Contributing Editor Greg Freiherr offers an overview of computed tomography (CT) advances at the Radiological Society of North America (RSNA) 2015. The video includes Freiherr during his booth tours with some of the key vendors who were featuring new technology.
Technology Report:
Computed Tomography (CT)
Related Content

Feature | Computed Tomography (CT) | By Melinda Taschetta-Millane
Computed Tomography (CT) continues to be a rapidly evolving technology with many new advancements, as displayed and…
 March 07, 2024
News | Radiology Imaging
March 5, 2024 — Life Guard Imaging, a pioneering leader in preventative imaging services, is thrilled to announce its…
March 05, 2024 
News | Artificial Intelligence
February 29, 2024 — AIxSCAN, Inc., a Sunnyvale, CA-based developer of a next generation artificial intelligence (AI)-…
February 29, 2024 Sponsored Content
Sponsored Content
Videos | Radiology Imaging
Today’s radiology teams are faced with a wide range of growing complexities such as patient and procedure variabilities ...
June 24, 2026 
News | Artificial Intelligence
February 27, 2024 — Median Technologies announced that the Company will be participating and speaking at the premier…
February 27, 2024 
News | X-Ray
February 26, 2024 — AIxSCAN, Inc. began clinical trials in late 2023. The AIxSCAN, Inc. team is very pleased with the…
February 26, 2024 
News | Computed Tomography (CT)
February 20, 2024 — Ultrahigh-spatial-resolution photon-counting detector CT improved assessment of coronary artery…
February 20, 2024 Sponsored Content

Feature | Information Technology
AT A GLANCE Organization: Expert Radiology Management Services, LLC Specialty: Subspecialty teleradiology — neuro and ...
May 01, 2026 
Videos | RSNA
At RSNA23, Imaging Technology News (ITN) spoke with Bhvita Jani, principal analyst at Signify Research, about…
February 07, 2024 
News | ACR
February 6, 2024 — An update to the CT Colonography Reporting and Data System (C-RADS) has been published Jan. 30 in…
February 06, 2024 
News | Artificial Intelligence
February 1, 2024 — Nearly 8,000 veterans are diagnosed with lung cancer each year. Now at-risk veterans will have…
February 01, 2024 Sponsored Content
Sponsored Content
Videos | Radiology Business
Radiology departments have many different needs and face a wide variety of challenges that can impact their departments ...
November 11, 2025 
News | Lung Imaging
January 25, 2024 — According to the American Journal of Roentgenology (AJR), high-frequency jet ventilation appears to…
January 25, 2024 
January 24, 2024 — Whole Body MRI, a private clinic committed to delivering accurate and comprehensive diagnostic…
January 24, 2024 
News | FDA
January 23, 2024 — Siemens Healthineers announces the Food and Drug Administration (FDA) clearance of syngo Virtual…
January 23, 2024 Sponsored Content
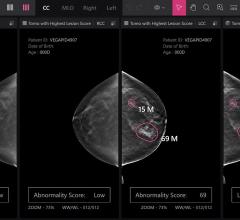
Feature | Breast Imaging
Despite decades of progress in breast imaging, one challenge continues to test even the most skilled radiologists ...
October 24, 2025 
News | Artificial Intelligence
January 22, 2024 — Thirona, a global company specializing in advanced analysis of thoracic CT images with artificial…
January 22, 2024 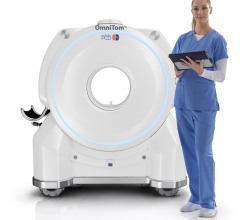
News | Computed Tomography (CT)
January 12, 2024 — NeuroLogica Corp. announced its OmniTom Elite PCD has received an Innovative Technology designation…
January 12, 2024 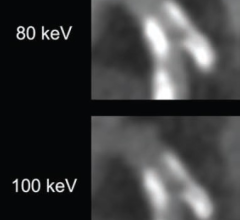
News | Cardiac Imaging
January 11, 2024 — According to the American Journal of Roentgenology (AJR), photon-counting detector (PCD) CT with…
January 11, 2024 
January 4, 2024 — Diagnosing cancer today involves using chemical “contrast agents” to improve the accuracy of medical…
January 04, 2024 
News | Lung Imaging
December 22, 2023 — Annual low-dose CT screening has been recently shown to result in high cure rates of over 80%, but…
December 20, 2023 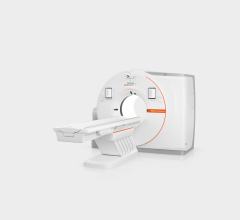
News | Computed Tomography (CT)
December 19, 2023 — Siemens Healthineers announced the Food and Drug Administration (FDA) clearance of the Somatom Pro.…
December 19, 2023 
December 13, 2023 — The X-ray fluoroscopy machine is a medical device frequently used in orthopedic surgery. Despite…
December 13, 2023 
News | Artificial Intelligence
December 11, 2023 — RapidAI, a global leader in developing artificial intelligence (AI) and technology workflow…
December 11, 2023 © Copyright Wainscot Media. All Rights Reserved.
Subscribe Now