Contributing Editor Greg Freiherr offers an overview of computed tomography (CT) advances at the Radiological Society of North America (RSNA) 2015. The video includes Freiherr during his booth tours with some of the key vendors who were featuring new technology.
Technology Report:
Computed Tomography (CT)
Related Content

News | Computed Tomography (CT)
Sept. 29, 2025 — Many studies have shown the inverse relationship between bone mineral density (BMD) — the gold…
 September 30, 2025
News | Computed Tomography (CT)
Sept. 26, 2025 — At the American Society for Radiation Oncology (ASTRO) 2025 annual meeting in San Francisco, Calif., …
September 29, 2025 
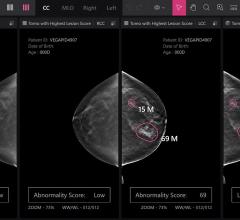
News | Mammography
Sept. 3, 2025 — According to ARRS’ American Journal of Roentgenology (AJR), a commercial artificial intelligence (AI)…
September 09, 2025 Sponsored Content
Sponsored Content
Videos | Radiology Imaging
Today’s radiology teams are faced with a wide range of growing complexities such as patient and procedure variabilities ...
June 24, 2026 
News | Computed Tomography (CT)
Sept. 4, 2025 — University Hospitals health system in Cleveland recently became the first healthcare institution in the…
September 05, 2025 
News | Computed Tomography (CT)
Sept. 4, 2025 — 4DMedical, a global medical technology company, has announced U.S. Food and Drug Administration (FDA)…
September 04, 2025 
News | Computed Tomography (CT)
Aug. 26, 2025— Esaote North America, Inc., a provider of dedicated MRI, Ultrasound, and Healthcare IT solutions, has…
August 27, 2025 Sponsored Content

Feature | Information Technology
AT A GLANCE Organization: Expert Radiology Management Services, LLC Specialty: Subspecialty teleradiology — neuro and ...
May 01, 2026 
News | Lung Imaging
Aug. 26, 2025 — Optellum, a global leader in AI for lung health, recently announced the world’s first thorax CT…
August 26, 2025 
News | Computed Tomography (CT)
Aug. 12, 2025 — MARS Bioimaging has appointed of Dr. Ojas Mahapatra as Group Chief Executive Officer. Mahapatra is an…
August 18, 2025 
News | RSNA 2025
Aug. 13, 2025 — Registration is now open for the RSNA 111th Scientific Assembly and Annual Meeting, the world’s leading…
August 13, 2025 Sponsored Content
Sponsored Content
Videos | Radiology Business
Radiology departments have many different needs and face a wide variety of challenges that can impact their departments ...
November 11, 2025 
News | Artificial Intelligence
July 22, 2025 — GE HealthCare has topped a U.S. Food and Drug Administration (FDA) list of AI-enabled medical device…
July 23, 2025 
News | Breast Imaging
QT Imaging Holdings, Inc. has announced the launch of its latest QTviewer, version 2.8.
QTviewer stores and displays…
July 21, 2025 
News | Computed Tomography (CT)
July 01, 2025 — NANO-X Imaging Ltd. recently announced a clinical and educational collaboration with Keiser University…
July 03, 2025 Sponsored Content
Feature | Breast Imaging
Despite decades of progress in breast imaging, one challenge continues to test even the most skilled radiologists ...
October 24, 2025 
News | PET-CT
June 19, 2025 — Building on a collaboration that spans more than three decades, GE HealthCare has renewed its research…
June 19, 2025 
News | Computed Tomography (CT)
May 15, 2025 — GE HealthCare has launched CleaRecon DL, technology powered by a deep-learning algorithm, to improve the…
May 15, 2025 
News | Computed Tomography (CT)
April 17, 2025 — Nano-X Imaging LTD has received 510(k) clearance from the U.S. Food and Drug Administration (FDA) for…
April 18, 2025 
News | Computed Tomography (CT)
April 16, 2025 — A new Harvey L. Neiman Health Policy Institute study found evidence that a new diagnosis of sarcopenia…
April 18, 2025 
News | Lung Imaging
April, 15, 2025 — Optellum has entered an agreement with Bristol Myers Squibb to leverage AI in early diagnosis and…
April 17, 2025 
News | Pediatric Imaging
April 10, 2025 — Cincinnati Children’s and GE HealthCare will form a strategic research program focused on driving…
April 10, 2025 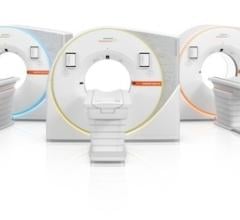
News | Computed Tomography (CT)
March 10, 2025 — Siemens Healthineers has received Food and Drug Administration clearance for its Naeotom Alpha class…
March 11, 2025 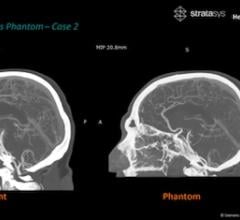
News | Computed Tomography (CT)
Feb. 25, 2025 —Stratasys Ltd. and Siemens Healthineers recently presented the results of a joint research effort that…
March 04, 2025 © Copyright Wainscot Media. All Rights Reserved.
Subscribe Now