Jan. 27, 2026 — Hyperfine has announced results from the largest data set to date evaluating stroke detection with its Swoop portable MRI system.
Radiology Imaging
The radiology imaging channel includes technology news related to computed tomography (CT), digital radiography (DR / X-ray), ultrasound, magnetic resonance imaging (MRI), radiographic fluoroscopy (R/F), mammography, angiography, 3-D printing, contrast media injectors, molecular imaging, neurological imaging, pediatric imaging and radiation dose management.
Jan. 27, 2026 — Hyperfine has announced results from the largest data set to date evaluating stroke detection with its ...
Jan. 22, 2026—The American Roentgen Ray Society (ARRS) will host a live virtual symposium, "Medical Imaging for ...
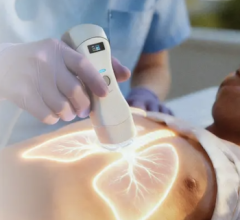
Jan. 27, 2026 — Siemens Healthineers and World Athletics have joined forces to inform medical teams how point-of-care ...
SPONSORED CONTENT — Fujifilm’s latest CT technology brings exceptional image quality to a compact and user- and patient ...
Jan.26, 2026 — SimonMed Imaging has unveiled an updated brand and the launch of SimonMed Longevity, a new division ...
Jan. 027, 2026 — QT Imaging and Olea Medical have announced plans to collaborate. This collaboration enhances QT Imaging ...
Jan. 26, 2026 — Nuclidium, a clinical-stage radiopharmaceutical company developing a proprietary copper-based ...
Agfa Radiology Solutions is committed to enhancing clinical outcomes and operational efficiency, underscoring its ...
Jan. 26, 2026 — Researchers at the University of Arizona were awarded up to $1.8 million by the Advanced Research ...
Jan. 21, 2026 — Aidoc recently announced that the U.S. Food and Drug Administration (FDA) cleared the industry's first ...
Jan. 22, 2026 — Qure.ai has received a grant from the Gates Foundation to develop a large open-source multi-modal ...
Agfa Radiology Solutions delivers diagnostic imaging solutions that set the standard in productivity, safety, clinical ...
Jan. 11, 2026 — The Global Refurbished Medical Imaging Equipment Market Size is projected to grow at a CAGR of 15.07% ...
Jan. 21, 2026 — Cathpax, a spin-off of the Lemer Pax group that designs, develops and commercializes team-wide, full ...
Jan. 21, 2026 — Fujifilm Healthcare Americas Corp. and Voicebrook, Inc. have announced a strategic partnership to ...
In June, the Philips Radiology Experience Tour hit the road to provide healthcare professionals with an opportunity to ...
Jan. 22, 2026 — The nomination deadline for the 2026 RSNA Rising Star Award is approaching. The Rising Star Award is ...
Jan. 20, 2026 — The American Society of Radiologic Technicians (ASRT) Foundation has named ASRT member Danielle McDonagh ...
Jan. 20, 2026 — Hyperfine, the developer of the first FDA-cleared AI-powered portable MRI system for the brain — the ...
Jan. 16, 2026 — Vega Imaging Informatics has announced the successful curation of the world’s largest digital breast ...
Jan. 14, 2026 — VizMark has received U.S. Food and Drug Administration FDA 510k clearance for VM1, a non-metal visual ...
Jan. 16, 2026 — In a proof-of-concept study funded by the National Institutes of Health, researchers from the Keck ...
Jan. 14, 2026 — Susan G. Komen, the world’s leading breast cancer organization commends Assemblymember Lori Wilson (D ...
Jan. 13, 2026 — A streamlined, nurse-led response for hospitalized patients experiencing an acute stroke at a Texas ...


 January 28, 2026


