
As 2022 comes to a close, the Imaging Technology News team takes a look at the year's most viewed content. Here is a ...
Coronavirus (COVID-19)
This page contains medical information for clinicians on the 2019 Novel Coronavirus (COVID-19, also called 2019-nCoV and now clinically SARS‐CoV‐2). This section includes articles on medical imaging of the virus for radiologists, new technologies being deployed to fight the virus and clinical information from various sources. Here are direct links for medical professionals to COVID-19 resources from the U.S. Food and Drug Administration (FDA), Centers for Disease Control (CDC) and the World Health Organization (WHO). Daily world-wide statistics on the coronavirus outbreak are available from the WHO Situations Reports. Centers for Medicare and Medicaid Services (CMS) frequently asked questions and answers (FAQs) for healthcare providers regarding Medicare payment for laboratory tests and other services related to the COVID-19

News | Coronavirus (COVID-19)
December 23, 2022 — In just two years, the Medical Imaging and Data Research Center (MIDRC) has released over 100,000 ...
 December 23, 2022
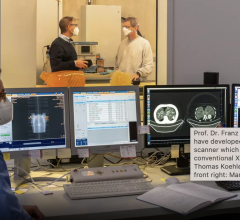
News | Coronavirus (COVID-19)
December 7, 2022 — A research team at the Technical University of Munich (TUM) has, for the first time, produced dark ...
December 07, 2022 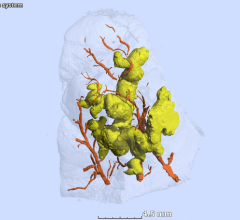
News | Coronavirus (COVID-19)
December 7, 2022 — Gross anatomy reveals three-dimensional shapes of pathology at a large scale. Histology, in contrast ...
December 07, 2022 
Feature | Radiology Business | By Melinda Taschetta-Millane
Here is a recap of what ITN viewers found most interesting during the month of November: 1. Top 10 Predictions for ...
December 05, 2022 
News | Computed Tomography (CT)
December 2, 2022 — New CT technology outperforms conventional CT in detecting subtle damage in the lungs of patients ...
December 02, 2022 
News | Coronavirus (COVID-19)
December 1, 2022 — COVID-19 infection is associated with increased liver stiffness, a sign of possible long-term liver ...
December 01, 2022 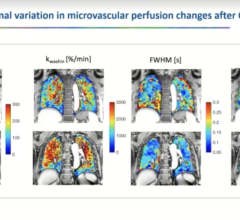
News | RSNA
November 30, 2022 — Findings from four separate studies on long-term impacts of COVID-19 were presented during a ...
November 30, 2022 
November 21, 2022 — Using a special type of MRI, researchers have uncovered brain changes in patients up to six months ...
November 21, 2022 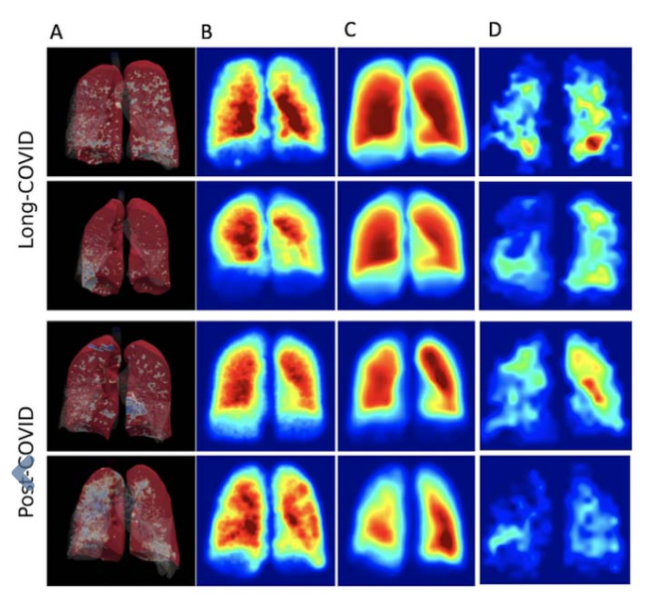
Feature | Radiology Business | By Melinda Taschetta-Millane
Here is a rundown of what you and your colleagues found to be most interesting in the field of medical imaging during ...
November 01, 2022 
Feature | Coronavirus (COVID-19) | By Melinda Taschetta-Millane
According to the American Academy of Pediatrics, as of October 6th, over 14.8 million children are reported to have ...
October 31, 2022 
Gallery | Coronavirus (COVID-19) | Melinda Taschetta-Millane and Dave Fornell
This photo gallery shows the variety of radiological presentations of COVID-19 (SARS-CoV-2) in medical imaging ...
July 01, 2024 
News | Coronavirus (COVID-19)
October 20, 2022 — A large study on the impact of long COVID found increased rates of health system use 2 months after ...
October 20, 2022 
Feature | Radiology Business
Here is a recap of what ITN viewers found most interesting during the month of September: 1. Lasting Lung Damage Seen in ...
October 03, 2022 
News | Radiology Imaging
September 27, 2022 — UK Biobank, the large-scale biomedical database and research resource, together with the Medical ...
September 27, 2022 
News | Coronavirus (COVID-19)
September 20, 2022 — Children and adolescents who have either recovered from COVID-19 or have long COVID show persistent ...
September 20, 2022 
Feature | Coronavirus (COVID-19)
Anthony S. Fauci, MD, who was instrumental in leading the country through the COVID-19 pandemic, announced today through ...
August 22, 2022 
News | Teleradiology
August 17, 2022 — In a study published today in the Journal of General Internal Medicine, researchers at the Icahn ...
August 17, 2022 
Feature | Radiology Business | By Melinda Taschetta-Millane
Here is what you and your colleagues found to be most interesting in the field of medical imaging during the month of ...
August 01, 2022 
Feature | AHRA | By Melinda Taschetta-Millane
The Association for Medical Imaging Management (AHRA) celebrated its 50th anniversary July 10-13, 2022, in Phoenix. To ...
July 25, 2022 © Copyright Wainscot Media. All Rights Reserved.
Subscribe Now