The majority of MRI scanners require about 1,500 liters of liquid helium to operate, but geopolitical unrest is putting severe strain on the helium supply chain, potentially reducing access to lifesaving scans.
PET-MRI
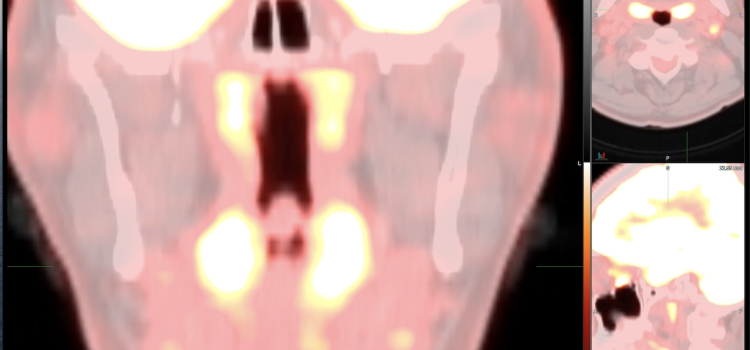
PET-MRI combines positron emission tomography (PET) and magnetic resonance imaging (MRI) into one imaging system. Positron emission tomography–magnetic resonance imaging (PET-MRI) is a hybrid imaging technology that incorporates magnetic resonance imaging soft tissue morphological imaging and positron emission tomography functional imaging.
-

-

June 10, 2026 — UTHealth Houston has launched a state-of-the-art PET/MRI imaging service, bringing together two advanced imaging technologies into a single integrated platform designed to enhance precision cancer care, support clinical research and expand opportunities in molecular imaging.
-

January 23, 2024 — Siemens Healthineers announces the …
-
January 17, 2022 — The Society of Nuclear Medicine and Molecular Imaging (SNMMI) issued a statement on Jan.
-

July 21, 2021 — Registration is now open for the Radiological Society of North America (RSNA) …

Feature | Magnetic Resonance Imaging (MRI)
The majority of MRI scanners require about 1,500 liters of liquid helium to operate, but geopolitical unrest is putting ...
 June 17, 2026
News | PET-MRI
June 10, 2026 — UTHealth Houston has launched a state-of-the-art PET/MRI imaging service, bringing together two advanced ...
June 12, 2026 
Feb. 27, 2026 — NYC Health + Hospitals/Jacobi | North Central Bronx recently unveiled a new $2 million MRI suite at the ...
March 05, 2026 Sponsored Content

Blog | Radiology Imaging
People who live in rural America may deserve the same quality healthcare as anyone living in the U.S., but it is not ...
September 13, 2019 
News | PET-CT
July 31, 2024 — In a head-to-head comparison with FDG PET/CT, FDG PET/MRI demonstrated comparable or superior diagnostic ...
July 31, 2024 
News | FDA
January 23, 2024 — Siemens Healthineers announces the Food and Drug Administration (FDA) clearance of syngo Virtual ...
January 23, 2024 
News | RSNA
December 1, 2023 — In today's healthcare environment, the industry faces various pressing challenges. The magnetic ...
December 01, 2023 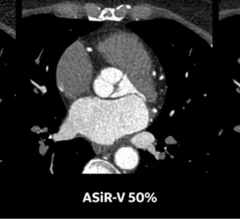
News | Radiology Imaging
November 30, 2023 — Through its leading imaging solutions and commitment to innovation, GE HealthCare remains at the ...
November 30, 2023 
News | SNMMI
June 28, 2023 — GE HealthCare is set to unveil SIGNA PET/MR AIR[i], at the Society of Nuclear Medicine and Molecular ...
June 28, 2023 
News | Artificial Intelligence
March 29, 2023 — In a partnership which aims to provide faster and safer medical imaging across Australia and New ...
March 29, 2023 
News | Coronavirus (COVID-19)
March 10, 2023 — Researchers found evidence of heart muscle inflammation in a small number of patients with acute ...
March 10, 2023 
News | SNMMI
June 22, 2022 — Andrei Iagaru, MD, FACNM, professor of radiology (nuclear medicine) and chief of the Division of Nuclear ...
June 22, 2022 
News | PET Imaging
June 21, 2022 — Markus Schwaiger, MD, a scientist known for his contributions to cardiac PET imaging, has been named as ...
June 21, 2022 
May 10, 2022 — At the ISMRM 2022 conference, Bruker announced the launch of innovative 7 Tesla and 9.4 Tesla conduction ...
May 10, 2022 
News | Coronavirus (COVID-19)
January 17, 2022 — The Society of Nuclear Medicine and Molecular Imaging (SNMMI) issued a statement on Jan. 14 regarding ...
January 17, 2022 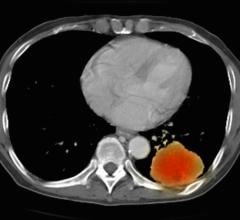
News | Molecular Imaging
December 29, 2021 — The global nuclear imaging devices and equipment market is expected to grow from $2.45 billion in ...
December 29, 2021 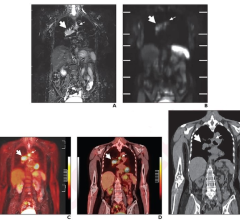
News | Lung Imaging
December 10, 2021 — According to an article in ARRS’ American Journal of Roentgenology (AJR), MRI—with or without FDG ...
December 10, 2021 
Feature | PET Imaging | By Todd Sasser, Ph.D.
The use of positron emission tomography (PET) imaging in preclinical oncology investigations has shown the ability to ...
September 14, 2021 
News | Nuclear Imaging
August 27, 2021 — The U.S. Department of Energy’s National Nuclear Security Administration (NNSA) issued two cooperative ...
August 27, 2021 
News | Molecular Imaging
August 2, 2021 — The global molecular imaging market was evaluated at $4.199 billion for the year 2019 growing at a CAGR ...
August 02, 2021 
News | RSNA
July 21, 2021 — Registration is now open for the Radiological Society of North America (RSNA) 107th Scientific Assembly ...
July 21, 2021 © Copyright Wainscot Media. All Rights Reserved.
Subscribe Now