
Sept. 30, 2024 — Siemens Healthineers recently announced the Food and Drug Administration’s premarket approval (PMA) for ...
Breast Imaging
Women's health related to breast imaging, including mammography, breast MRI, ABUS, automated breast ultrasound, breast ultrasound, breast biopsy, PEM and positron emission mammography.
News | Breast Imaging
Aug. 28, 2024 — Rezolut, LLC recently debuted its latest offering for patients during their annual mammogram ...
 August 29, 2024
News | Breast Imaging
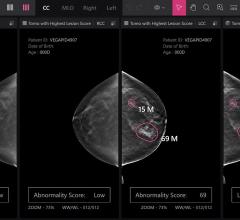
July 29, 2024 — Lunit, a leading provider of AI-powered solutions for cancer diagnostics and therapeutics, announced the ...
July 29, 2024 Sponsored Content
Feature | Breast Imaging
Despite decades of progress in breast imaging, one challenge continues to test even the most skilled radiologists ...
October 24, 2025 
News | Breast Imaging
July 29, 2024 — iCAD, Inc., a global leader in clinically proven AI-powered cancer detection solutions, announced a ...
July 29, 2024 
Videos | Breast Imaging
Don't miss ITN's latest "One on One" video interview with AAWR Past President and American College of Radiology (ACR) ...
July 24, 2024 
News | Flat Panel Displays
July 17, 2024 — LG Electronics (LG) is accelerating its B2B medical device business, expanding its lineup of diagnostic ...
July 17, 2024 Sponsored Content
Feature | Breast Imaging
While most women understand the importance of health screenings, an estimated 72 million have missed or postponed a ...
December 03, 2024 
News | Artificial Intelligence
July 9, 2024 — Lunit, a provider of Artificial Intelligence (AI)-powered solutions for cancer diagnostics and ...
July 09, 2024 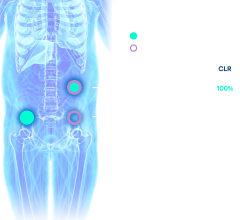
News | Prostate Cancer
July 5, 2024 — Lantheus Holdings, Inc., a leading radiopharmaceutical-focused company committed to enabling clinicians ...
July 05, 2024 
News | Breast Imaging
July 2, 2024 — Delphinus Medical Technologies, a pioneering medical imaging company that developed the SoftVue Breast ...
July 02, 2024 Sponsored Content
Sponsored Content

Webinar | Mammography
The COVID-19 pandemic had a huge impact on the radiology community. Hospitals, doctors’ offices and clinics found ...
March 03, 2022 
News | Artificial Intelligence
June 26, 2024 — iCAD, Inc., a global leader in clinically proven AI-powered cancer detection solutions, announced it ...
June 26, 2024 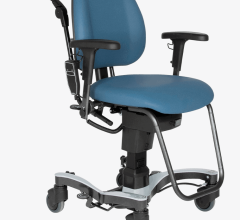
News | Breast Imaging
June 20, 2024 — The technologically advanced VELA Mammography Chair, offered by Enable Me, a VELA Medical company ...
June 20, 2024 
News | Breast Imaging
June 18, 2024 — Delphinus Medical Technologies, a pioneering medical imaging company that developed the SoftVue Breast ...
June 18, 2024 Sponsored Content
Sponsored Content
Videos | Artificial Intelligence
Artificial Intelligence (AI) is becoming more common place in radiology practices, and emerging technologies are ...
November 11, 2020 
News | MRI Breast
June 12, 2024 — Royal Philips recently announced the 1,111th installation of its revolutionary BlueSeal 1.5T magnet ...
June 12, 2024 
News | Breast Imaging
June 7, 2024 — Scholars and studies funded by Susan G. Komen(R), the world’s leading breast cancer organization ...
June 07, 2024 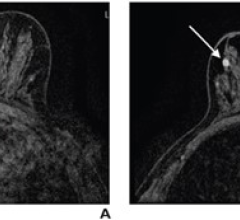
News | Breast Density
June 6, 2024 — Subsequent rounds of abbreviated breast MRI (AB-MR) screening in patients with dense breasts had lower ...
June 06, 2024 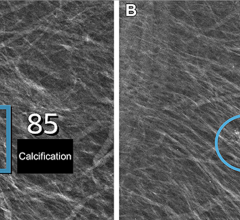
News | Breast Imaging
June 4, 2024 — Using artificial intelligence (AI), breast radiologists in Denmark have improved breast cancer screening ...
June 04, 2024 
Feature | Radiology Business | By Melinda Taschetta-Millane
As we flip the page to a new month on our calendars, here is a look at the Top 10 pieces of content viewers were reading ...
June 04, 2024 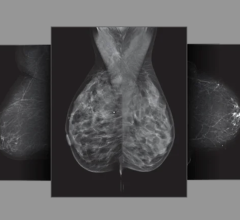
News | Breast Imaging
May 28, 2024 — iCAD, Inc., a global leader in clinically proven AI-powered cancer detection solutions, announced a ...
May 28, 2024 
News | FDA
May 22, 2024 — The U.S. Food and Drug Administration (FDA) has issued a recall of the Hologic Inc. BioZorb marker due to ...
May 22, 2024 
News | Artificial Intelligence
May 22, 2024 — Lunit, a provider of Artificial intelligence (AI)-powered solutions for cancer diagnostics and ...
May 22, 2024 © Copyright Wainscot Media. All Rights Reserved.
Subscribe Now