July 25, 2016 — The Centers for Medicare and Medicaid Services (CMS) announced that it expects to launch its new Overall Hospital Quality Star Rating system to report on quality of care at hospitals shortly.
The Star Rating can be viewed at Hospital Compare, a consumer-oriented website that provides information on how well hospitals provide care to their patients. This information can help consumers make informed decisions about their healthcare. CMS has been posting quarterly hospital quality star ratings based on patients’ experience of care on the Hospital Compare website since April 16, 2015.
The new Overall Hospital Quality Star Rating reflects comprehensive quality information about the care provided at the nation’s hospitals. The rating system, developed through a public and transparent process, takes 62 existing quality measures already reported on the Hospital Compare website and summarizes them into a unified rating of one to five stars. The rating includes quality measures for the routine care an individual receives when being treated for heart attacks and pneumonia to quality measures that focus on hospital-acquired infections, such as catheter-associated urinary tract infections. Key measures included in the Star Rating ask questions such as:
- How often do patients get an infection after surgery?;
- How long on average do patients have to wait in the emergency department before seeing a provider?;
- How often do patients develop complications after hip replacement surgery?;
- How likely are patients to get readmitted to the hospital after a heart attack?; and
- Will patients receive multiple computed tomography (CT) scans or magnetic resonance imaging (MRI) scans?
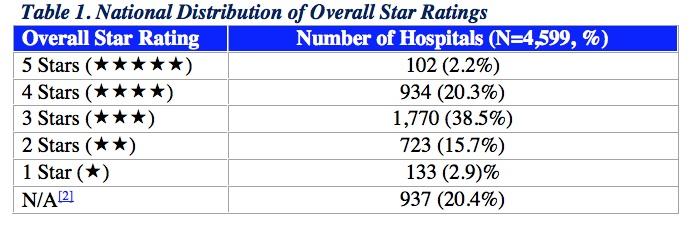
CMS intends to post the Overall Hospital Star Ratings for individual hospitals shortly. In preparation, the agency published some data showing the national distribution of Overall Hospital Star Ratings based on hospital characteristics. For each hospital characteristic, such as teaching status or safety net status, CMS evaluated the distribution of hospitals across the five star categories (1, 2, 3, 4, and 5 stars).
CMS examined the relationship between each hospital characteristic and the national distribution of the Star Rating. For each hospital characteristic, CMS compared the number of hospitals, the mean Star Rating and the range (or the minimum and maximum Star Ratings). CMS evaluated the distribution of hospitals across the five star categories within each hospital characteristic. CMS also examined the distribution of hospital performance at the group level for each hospital characteristic using the hospitals’ performance categories (Above, Same as, Below the National Average) for each of the seven groups.[1]
The agency utilized hospital data from the July 2016 star ratings input file and defined the hospital characteristics based on the 2013 American Hospital Association (AHA) annual survey of hospital characteristics and the 2016 CMS IMPACT file, which is used for determining if a hospital is eligible to be a disproportionate share hospital.
The analysis showed that all types of hospitals have both high-performing and low-performing hospitals. In other words, hospitals of all types are capable of performing well on star ratings and also have opportunities for improvement.
Overall Star Rating Results based on Bed Size
Hospitals of varying bed size — classified as 1-99, 100-199 and 200-or-more beds — had similar average Star Ratings. Each bed size classification included hospitals with a Star Rating ranging from 1 to 5 stars.
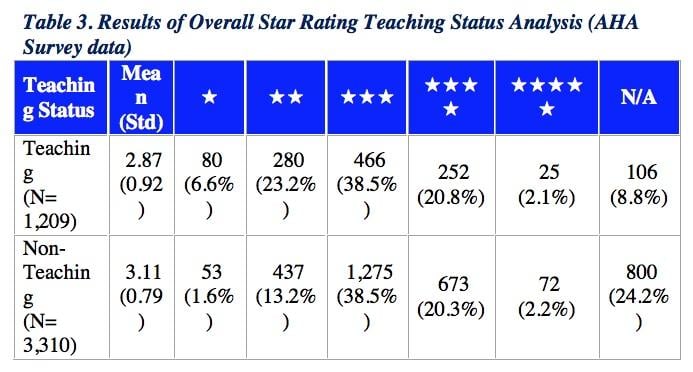
Overall Star Rating Results based on Teaching Status
The average Star Rating for teaching hospitals (mean = 2.87) was similar to but slightly lower than that for non-teaching hospitals (mean = 3.11). Both teaching and non-teaching status hospitals had high-performing and low-performing hospitals on the Star Ratings, ranging from 1 to 5 stars.
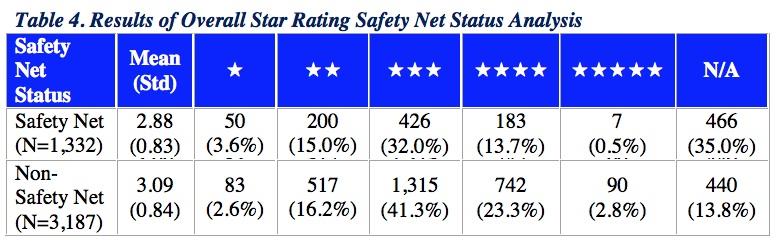
Overall Star Rating Results based on Safety Net Status
Applying a previously accepted definition of hospital safety net status,[3] CMS found that safety net hospitals were similar to but had a slightly lower average Star Rating (mean = 2.88) than non-safety net hospitals (mean = 3.09). Both safety net and non-safety-net hospitals had high-performing and low-performing hospitals on the Star Ratings, ranging from 1 to 5 stars.
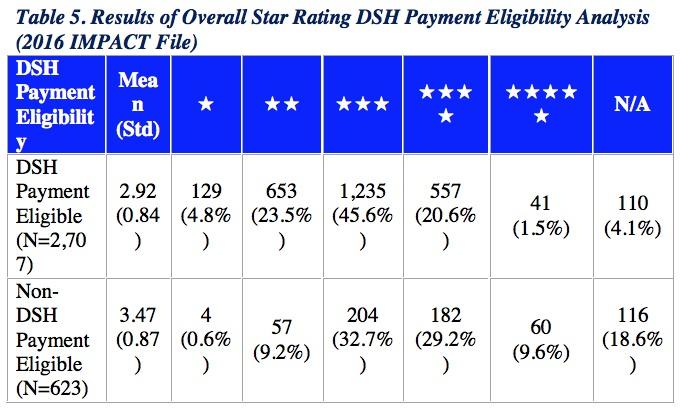
Overall Star Rating Results based on Disproportionate Share Hospital (DSH) Payment Eligibility
CMS found a lower average Star Rating among DSH payment-eligible hospitals (mean = 2.92) in comparison to non-DSH payment-eligible hospitals (mean = 3.47). Both DSH payment-eligible and non-DSH payment-eligible hospitals groups had hospitals with Star Ratings ranging from 1 to 5 stars.
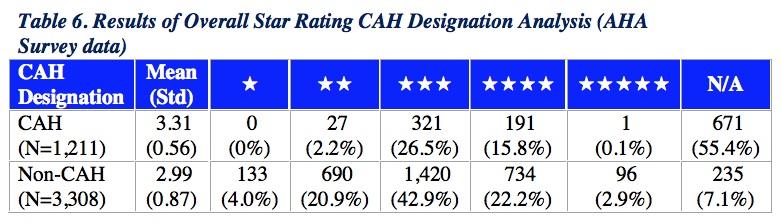
Overall Star Rating Results based on Critical Access Hospital (CAH) Status
CMS found a higher average Star Rating among CAHs (mean = 3.31) in comparison to the average Star Rating among non-CAHs (mean = 2.99). The range of among CAHs was more narrowly distributed, from 2 to 4 stars, while the range of Star Ratings among non-CAHs was more broadly distributed, from 1 to 5 stars.
For more information: www.cms.gov


 July 28, 2026