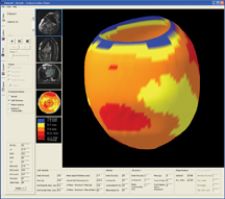
In segmentation, algorithms identify specific features in an image. Photo courtesy of Cedara
As the medical imaging market grows rapidly, so does the size of image data sets. These huge data sets have in turn given rise to new workflow tools and techniques to better process these studies, moving 3-D visualization into the realm of data quantification and analysis.
One of the main drivers for 3-D visualization is a trend toward increasing amounts of data acquired by scanners.3 The industry has witnessed this with the adoption of 64-slice CT scanners, which capture over 1,000 images within each series, and with combined scanners, such as PET and CT, which acquire several datasets at the same time. Outside of the typical hybrid scanners, the research community is pushing for multimodality display for SPECT/CT and MR/PET, as well as solutions that register and fuse any modality with another. Scanners acquire images faster than ever before, and this is triggering new protocols to look at the same organ over time. This, subsequently, involves the use of functional information, which results in 4-D image data, as seen with the introduction of cardiac CT.
Single-Integration Engines
Because of the quantity of information being displayed, significant impacts are being felt in the load, transmission and processing of image data. One of the first issues is the management of the various specific applications that process this imaging data. An application can apply only a few optimizations across the board, such as optimized loading. Since the exams it handles are used in very different clinical scenarios, they must be optimized individually.
Furthermore, the market is demanding that software be delivered as a set of integrated clinical packages. These packages will be designed to solve well-defined clinical problems, and they will fully support automation and optimized workflow. PACS workstations will support this concept through automatic rules. Viewing protocols will move to a completely new arena as systems automatically launch “the best” clinical protocols. This type of approach with clinical protocols will extend traditional PACS beyond radiology into fields of oncology, cardiology, pharmacy, surgical navigation and more. The future will see an organization using a single “integration engine” for plugging in multiple specialty applications.1 In fact, the DICOM Working group 23 is now focusing its efforts on development of a standard for application hosting.2
Additionally, many specialist capabilities, such as coronary artery analysis, have historically been developed to run on separate workstations. As demand has increased for clinical applications, the industry is now pushing for integrating these “island” applications into one common display, without losing “best of breed” capabilities from individual clinical applications.
Beyond a common display and integrated desktop, the Internet is an additional requirement to consider. The Web continues to have a major impact on healthcare, both in terms of collaboration and software deployment. Collaboration between different clinicians is becoming increasingly possible, as medical images and information are available in any location via Web-enabled applications. Research and development efforts are based on thick-client (all processing done on the client), hybrid-client (some processing on server, some on client) and thin-client (all processing done on the server) models to support Web-enabled applications.
Applications Outside of the Radiology Box
On an application-specific level, the large datasets are pushing applications into a new focus on quantification and analysis. New visualization tools include “outside the box” applications. For example, the imaging industry is leveraging technology developed for the game market – the graphics card. Today, graphics card power is comparable, and often superior, to CPU power, and use of graphics cards can help with handling large datasets, specifically with rendering 3-D views or reformatted views of datasets.
Quantification and Analysis Tools
Quantification and analysis is the next logical follow-up after visualization, allowing medical professionals to derive additional information from images, such as the volume or surface area of different anatomical features. In this sense, quantification and analysis software can be used to help a clinician determine which part of the data is relevant to the diagnosis and to better assess how it is relevant.
An example involving a cardiac CT case illustrates the need for new tools. A cardiac CT study can generate in excess of 10 stacks of images, over different time periods, amounting to thousands of images to be reviewed. While a clinician may be interested in identifying stenosis, coronary arteries represent relatively small, tortuous structures inside this data set. Because coronary arteries have the same density as a ventricle, isolated visualization of these structures cannot be achieved using simple threshold techniques. Stenosis identification can take a clinician a substantial amount of time. Additional software tools, however, may be able to assist in coronary identification and the analysis of coronary narrowing.
Mainstream radiology imaging can learn from other fields in which quantitative image analysis has been the norm for years, such as nuclear medicine and nuclear cardiology. A nuclear cardiology exam typically images the blood supply of the heart when the patient is resting and when exercising. Fully automated software calculates numerous parameters from this data: ejection fraction, chamber volumes, filling rates, comparisons to population normals, details of how the heart wall moves and thickens as it contracts and more. The software produces an extensive report card on cardiac performance – information that can help identify a broad range of cardiac problems.
In the clinical trial market, quantification has also been the primary objective of each investigator. The standard for tumor quantification, RECIST and WHO, have been used for a long time. New demands for volumetric measurements in the clinical trial market are now becoming commonplace.
Image Fusion and Algorithms Drive Analysis
Other technologies are products of the trend in quantification and analysis, including CAD (computer-aided diagnosis) and image fusion. In the past few years, several CAD products have been released into the market, including breast CAD, lung CAD and colon CAD. As an advanced analysis tool, image fusion also represents one example of the medical imaging industry’s move toward improved capabilities for quantification and analysis. PET/CT, for example, enables the display of anatomical and molecular data simultaneously, which has been proven clinically important in areas of radiology, oncology, neurology and cardiology. This marks an important shift for medical imaging where practitioners can not only visualize anatomy but also its functional activity.1
A key element of image fusion is registration, or the process in which an algorithm defines how multiple images (or datasets) will be aligned. Today, the most widely accepted form of registration is known as rigid body registration. Rigid body registration aligns two datasets by performing transformations such as pan, zoom and rotation to linearly align the datasets. To extend the capabilities of fusion, a new, more flexible method of registration named nonrigid/elastic or deformable registration is also being developed. This algorithm deforms one of the datasets in a nonlinear fashion to create alignment between images. The need for nonrigid registration is evident, for example, in an instance where two abdomen datasets need to be aligned. One dataset has the patient holding their abdomen and the other does not. Rigid body registration cannot align the images because the patient’s abdomen is shaped differently. Using nonlinear transformations, however, these two images could be aligned, in a form of nonrigid registration.
Today, fusion is primarily used between different modalities, such as PET and CT, where combined images can simultaneously display divergent patient information, such as molecular and anatomical data. Future areas of development in fusion technology are focusing on pre- and post-analysis or follow-up. In this context, fusion can be used to analyze studies longitudinally, merging patient images from different time points to chart the progression of a disease. This is another type of fusion, which has not been fully explored by the market as of yet, but is likely to see growing demand in coming years. This application will also be another driver for large dataset size, and will leverage quantification as a means to verify the clinical outcome.1,4
Another specific technology worthy of special note is segmentation. Algorithms capable of identifying specific features in an image are more and more common. For instance, several X-ray console vendors offer the ability to locate and eliminate the collimator automatically from images. Several cardiology packages offer the ability to identify the blood pool from CT or MR images.
Quantification is making its first steps in the radiology space, but standardization in data acquisition and processing will be required in order for this to be reproducible and therefore reliable.4
The increasing data set size of studies has greatly improved the diagnostic capabilities of today’s physicians. However, they are pushing the system requirements for overall imaging solutions and driving new tool development within applications. As these new trends are implemented fully, the constraints of dataset size will be minimized.
References:
1 “Multimodality Imaging: Fusing Imaging for the Future” http://new.reillycomm.com/imaging/article_detail.php?id=26
2 Dicom Working Group 23, Presentation from Lawrence Tarbox, PhD, Washington University at St. Louis https://www.mcim.georgetown.edu/MCIM2006/DesktopModules/ViewDocument.as…
3 Frost & Sullivan report “U.S. Medical Imaging Industry Outlook A630-50”, 2004 page 12-5. http://www.frost.com/prod/servlet/catalog-download.pag?catid=A630-01-00…
4 Dr. Paul Babyn talk at “Grand Mathematical Challenges in Medical Image Processing” http://hi.uwaterloo.ca/hi/notoc-presentation-archive-fields-Babyn.htm

 June 18, 2026


