With all areas of healthcare now migrating to electronic medical record (EMR) platforms, the data they contain can be mined to use increasingly sophisticated analytics software. This includes pulling information to improve department or hospital management, quality assurance to boost outcomes and efficiency, and even the ability to identify patients who are ideal referrals for new clinical programs such as low-dose lung computed tomography (CT) cancer screenings, or candidates for peripheral artery disease revascularization.
Analytics software was one of the top trends seen at the 2016 meeting of the Healthcare Information and Management Systems Society (HIMSS). This article is an overview of analytics presentations from that conference.
With most EMR implementations now complete, providers are shifting resources from the EMR implementation to analytics and population health, said Jonathan Niloff, M.D., vice president and CMO of McKesson’s connected care and analytics division. He said today’s analytical software is much more sophisticated than in the past, where all data points from the EMR and interconnected information technology (IT) systems can now be searched in one location.
Basic analytics data has been available for years but required time-consuming, manual tabulation of data points. Dashboarding features to automatically track specific data have been around for several years to offer overview of key departmental statistics. Over the past year, there has been a wave of new and much more sophisticated analytics software packages released on the market. These are no longer tied to pulling data from one vendor’s IT system, but operate as a third-party software with the ability to pull data from numerous data sources, including not only the EMR but patient reporting systems, picture archiving and communication systems (PACS), cardiology information systems, ADT, medical coding and billing systems, inventory management and lab reports. These systems also offer data beyond traditional software systems, tapping into the raw data of diagnostic modalities and ancillary devices themselves, including CT, digital radiography (DR), angiography and automated contrast injectors. This data can be leveraged to identify trends in usage, contrast dose by procedure or protocol, and radiation doses used.
As interoperability between data and imaging systems has improved, analytical software can now perform more complex data mining, such as reviews of imaging radiation dose levels by patient, by protocol or modality. Outliers in these reports can be clicked on to drill down data to see which machine that exam was performed on, the tech who performed the exam, or look at the specific patient’s EMR data to see if they are extremely obese or if there are other reasons that required a higher X-ray dose. If a particular machine or technologist is suspected of having quality issues, the newer analytics systems can pull historical data for a particular machine or technologist to see if there are other outlier exams, which may identify staff that need additional training or older equipment that needs to be replaced.
New analytics software can pull data from operating room or cath lab procedures to track average procedure time and the costs of the procedure by CPT code, types of procedures, disease state, specific physicians or specific implantable devices.
Business uses include better management of inventory, procedural room use, imaging utilization, staff performance, radiation dose management, monitoring factors for patient satisfaction and to help identify bottlenecks in patient discharge, door-to-balloon times, STAT radiology reads and what contributes to poor or improved patient outcomes. This data has been available for years at many facilities, but it is the new level of analytics software integration that now makes data mining possible for all these things on one screen using one program.
Watch a video explaining how analytics can help improve workflows.
Watch the VIDEO “The Role of Analytics in Value-Based Healthcare.”
Watch the video "Data-Driven Decision-Making for Radiology Management," from AHRA 2016.
New Analytics Software Integration
Two major analytics software releases in the last year were from GE Healthcare and Siemens. They illustrate the new breed of analytics software being released by numerous vendors today, both large and small. Both vendors created a common, vendor-neutral analytics platform that can operate on both their information systems and those of other vendors. These platforms can be sold separately from other GE or Siemens products as a third-party software system. Both systems sit on top of the EMR, ADT, PACS, cardiovascular information system (CVIS) and other hospital and patient reporting systems. With a big focus now on enterprise IT systems, both vendors say their platforms act as an integration engine for all the -ologies across the healthcare enterprise.
From a cardiology prospective, GE’s system, part of the new GE Cloud product launched at the Radiological Society of North America (RSNA) 2015 annual meeting, can pull up inventory management system data and link disposables and implantable device usage to specific costs, procedures, procedure types, specific physicians, drugs used, expenditures to date and show where specific items are located in departments. The software can also pull data by physician, procedure type, procedure stats based on patients risk scores, length of stay or disease states. Specific outlier patients can easily be identified and data specific to these cases pulled for review.
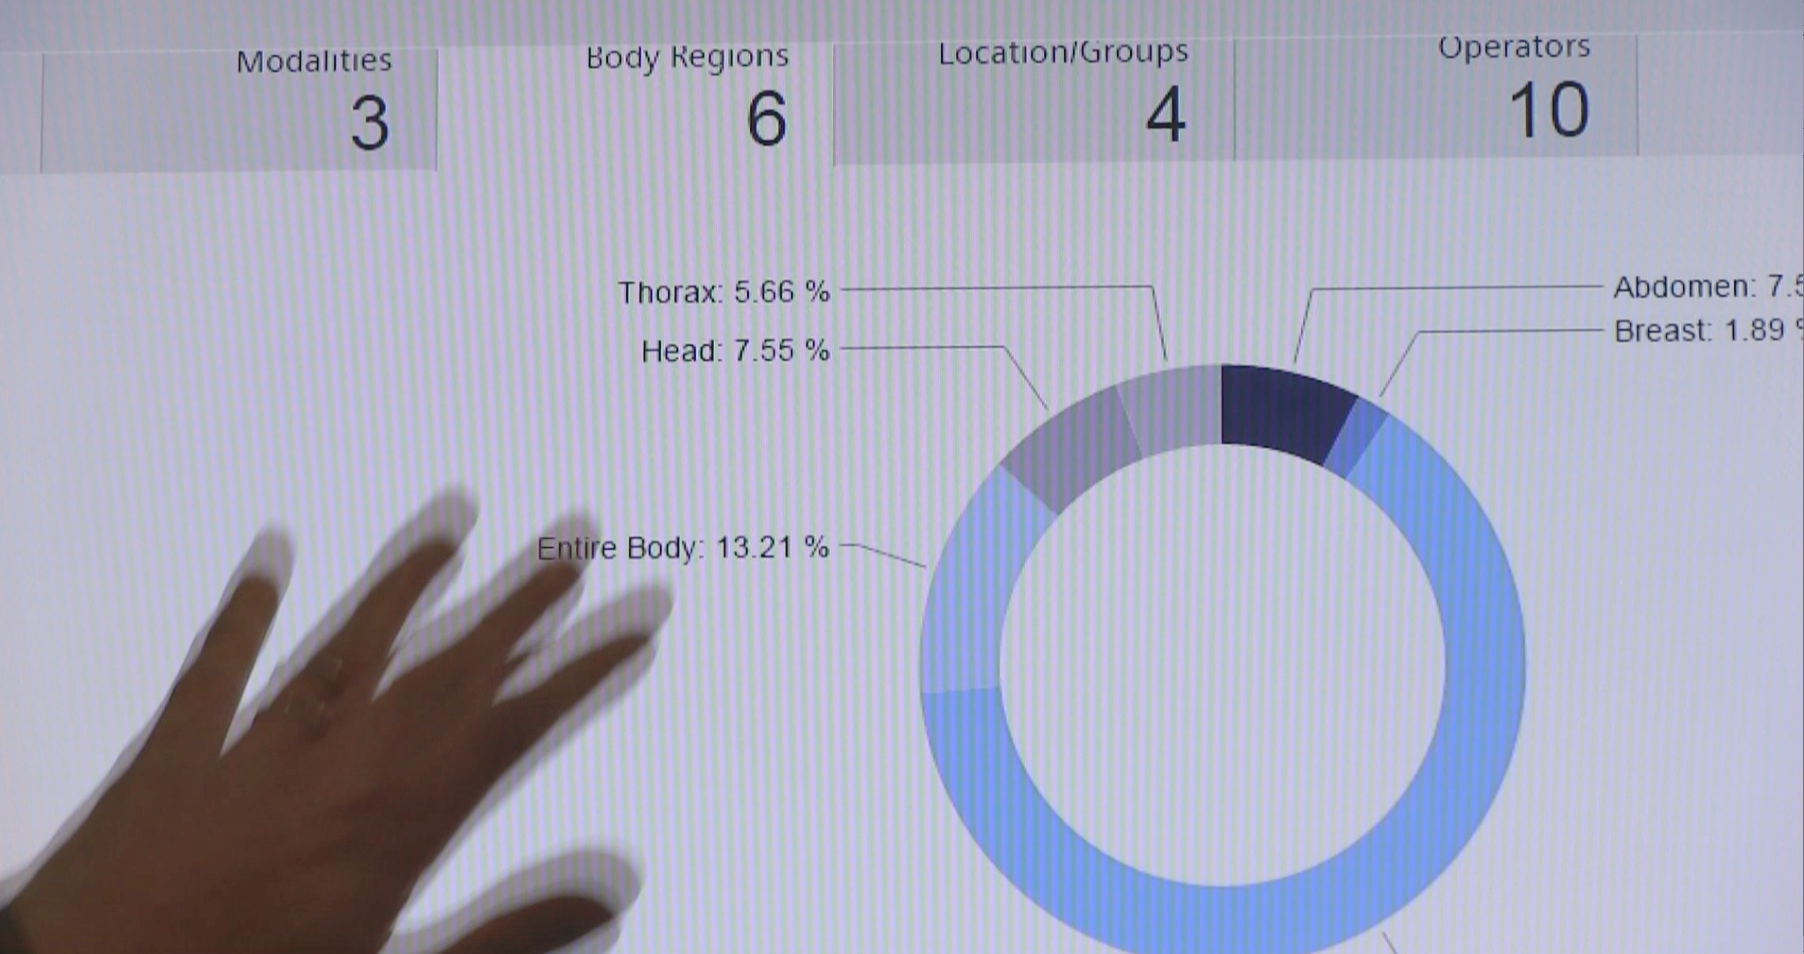
From a radiology prospective, Siemens Teamplay, launched in 2015, is another example of the simplification of data analytics using a single-point-of-access software. It can be set for any parameters to alert users if that threshold has been reached or exceeded. Siemens said this is particularly useful in X-ray radiation dose monitoring. The software allows side-by-side comparison of a facility’s CT scanner doses with other scanners at the same hospital or healthcare system, comparisons with American College of Radiology (ACR) reference levels or from other Teamplay users.
Data Analytics Implementation Can Be Adversarial
Many healthcare system IT departments found they ran into an “us vs. them” mentality when they first attempted to share analytics with clinical staff. There was a perception that the data was going to be used to micromanage departments or discipline staff. There were also questions as to how IT staff were going to pull anything meaningful that could improve clinical workflows or outcomes.
“Credibility is the biggest barrier for us, and that is why transparency is so important,” said Thomas Van Gilder, M.D., JD, MPH, CMO and vice president of informatics and analytics, Transcend Insights, Cambell, Calif. “You need to show this data is specific to patients — not C-suite business analytics. You can connect specific data points to specific patients — that is what will show clinicians how data can help with clinical collaboration to aid care and improve quality. This can also help reduce the ‘us vs. them’ approach to data from payors. You need to work with them on user engagement and make sure you learn what they need, not just try to sell something you developed.”
“You have meetings to make changes and more meetings and changes, that is part of the process. You are designing a new product and it does not matter how I think it should work, it needs to meet the needs of the clinicians using it,” said Thomas Carlough, Pharm.D., manager of analytics for pharmacy and quality, Atlantic Health Systems, Morristown, N.J.
IT staff tasked with helping clinicians improve the quality of their work also need to focus on data that is relevant to their audience.
“As a clinician, I need to know my audience when presenting analytics data,” said James Whitfill, M.D., CMO, Scottsdale Health Partners, Phoenix, Ariz. “When I present to orthopedic surgeons about pressure ulcer rates, they don’t care. They want to know about days to discharge or incision infection rates that pertain to their procedures.”
Danyal Ibrahim, M.D., MPH, MHCDS, chief data and analytics officer, St. Francis Hospital, Hartford, Conn., said there are several acceptance stages to data, including denial, anger, the acceptance and then transformation via improvements to change the data. He explained you need to share data freely and show how it was derived. Data is not valid unless the clinicians responsible for it sign off on it to ensure it is correct, he explained. Another tip is including names of clinicians on data, as this makes it more usable and hits closer to home than anonymous statistics.
“If doctors and staff are given easy access to the data, they will view it and work to improve,” said analytics company Health Level CEO Parag Paranjpe. “We found this works better than having someone else monitor the data with the threat of a stick if they do not improve.”
Paranjpe said the ability to quickly review data often reveals issues that the clinicians did not realize were present. However, the information needs to be simple and quick to access and it helps if it is in a graphical format that quickly shows where there are problems.
Leveraging Analytics to Improve Care
Coordination of care has become increasingly important at many hospitals. Whitfill said his hospital analyzed records from 10,000 of its patients and found mixed results and areas where they need to improve. However, the analytics also showed the coordination efforts added up to a significant financial savings, based on their own data and Centers for Medicare and Medicaid Services (CMS) data on those same patients.
St. Francis Hospital implemented a heart failure registry of its patients to track their analytics in an effort to cut its readmission rate. Ibrahim explained an example of the system: He said they were to see 20 patients who had recent heart failure readmissions and they looked at who made up the care team for these patients. They also looked for data on these patients to see if they had home healthcare, or if they were sent to a nursing home to see if these might have been factors. Also, were discharge instructions clear or were they followed. If all of the readmission patients were sent to the same nursing home, or if there were missing drug orders at discharge, that can help identify that maybe the post-acute care was the issue, Ibrahim explained.
“In many ways, the cardiologist becomes the heart failure patient’s primary care physician, so we developed a report to look at vitals to help them monitor these patients,” he said. This includes in-patient and out-patient records for labs, ejection fractions, weight records, etc. He said these basic vitals can help track a patient’s condition and potentially alert the cardiologist to a worsening condition so they can intervene early and avoid a readmission. The analytics also help discover a disconnect between medical coders and the physicians, so they now have staff assigned to coordinate better to ensure the medical coding is correct.
Sometimes it is helpful to think outside the box with analytics to find new information that was not previously available to improve care. One example of this was found at Atlantic Health Systems, when clinicians found they could track hospital meals consumed for diabetic patients so they had a better understanding of these patients’ diet, Carlough said. He said another way analytics helped improve diabetic care was when they found one outlier patient who had consistently poor outcomes. When it was brought to the attention of the nursing staff, they explained that patient insisted on injecting the insulin themselves, but the data showed the patient was not administering it properly.
Watch the VIDEO "Minneapolis Heart Institute Saves With Analytics Software."
Population Health
Beyond departmental analytics, software can be leveraged to pull stats from across a healthcare system, or across a regional health information exchange. These data can help identify patient populations that are targets for new programs, such as low-dose lung CT screening for lung cancer, patients with diabetic foot ulcers or other symptoms who may benefit from a critical limb ischemia revascularization program, or to preemptively identify and screen patients at high risk for developing heart failure before developing acute symptoms, or CT cardiac calcium scoring screenings of patients who are not sure if they should go on statin therapy.
Read the related 2017 article "Market Growth in Healthcare Analytics"


 May 21, 2025