A PET-CT head and neck cancer scan showing various image reconstructions. The top left image is the separate CT scan showing the anatomy. The top right scan shows the fused PET and CT scans with false color added to help interpret the image. The bottom left scan is an initial FDG PET image showing tracer hot spots in the neck and a lymph node in the right jaw due to cancer. The right bottom image is a delayed enhancement scan showing tracer uptake over time, with normal hot spots in the bladder, kidneys, testicles and brain, which normally have higher metabolic activity. The low-grade gray shading of the anatomy is due to the normal cellular metabolism uptake of the FDG throughout the body.
Positron emission tomography (PET) is a nuclear imaging technology (also referred to as molecular imaging) that enables visualization of metabolic processes in the body. The basics of PET imaging is that the technique detects pairs of gamma rays emitted indirectly by a positron-emitting radionuclide (also called radiopharmaceuticals, radionuclides or radiotracer). The tracer is injected into a vein on a biologically active molecule, usually a sugar that is used for cellular energy. PET systems have sensitive detector panels to capture gamma ray emissions from inside the body and use software to plot to triangulate the source of the emissions, creating 3-D computed tomography images of the tracer concentrations within the body.
Hybrid PET Imaging Systems
A common question from patients is what is a PET-CT scanner? Today, most standalone PET imaging systems have been replaced by hybrid PET-CT (positron emission tomography - computed tomography) scanners, which combine separate PET and CT imaging systems into one gantry to allow fused, simultaneous imaging using PET and X-ray CT. The CT system offers anatomical detail and helps with attenuation correction for the PET imaging for more accurate, clearer PET image reconstructions. The overlay of fused CT images on the PET scans can help pinpoint “hot spots” of tracer uptake, such as cancerous tumors. These can be used to help make a more accurate diagnosis, aid tumor monitoring or tracking during chemotherapy, and aid in either surgical or radiation therapy planning.
A newer trend in PET imaging technology introduced over the past few years are PET-magnetic resonance imaging (PET-MRI) systems. These hybrids use MR to eliminate additional radiation dose from CT and enable greatly improved soft tissue imaging clarity, which CT cannot provide. This improved soft tissue clarity aims to improve accurate localization of tracer hot spots in the anatomy for better diagnosis and treatment.
Read about PET-MRI’s entry into the U.S. market.
Read more about advances in PET-CT systems.
PET vs. SPECT
PET is considered to have improved image clarity over SPECT (single-photon emission computed tomography). However, advances in more sensitive detector technology, image reconstruction software and development of new radiotracers have lead to improvements in SPECT. Both technologies have advantages and disadvantages, including different radiation doses, variations in image quality, ease of use, access to tracers and cost.
Read more about limitations and comparison of PET and SPECT technologies.
What Are Radiotracers — How do Radiotracers Work
There are several biologically active molecules that can be labeled with a radioactive tracer element for PET imaging. These various tracers and biologically active molecules are tailored for enhancing specific disease states in the imaging, including a variety of cancers, brain ischemia due to stroke, cardiac ischemia due to heart attacks and inflammation.
Biologically active molecules are compounds normally used by the body, including glucose, water or ammonia. Other types of molecules can be targeted to bind with specific receptors found mainly on cancer cells or other disease markers. PET imaging traces the biologic pathway of these compounds or receptors inside the body.
The most common biologically active molecule used in PET is flurodeoxyglucose (F-18 FDG), which is an analog of glucose. It is used in about 90 percent of PET scanning in the United States. Cells in the body metabolize this sugar for energy, so high concentrations of FDG seen on PET indicate areas of high metabolic activity (as in cancer). Areas of low or no metabolic activity can indicate areas of reduced blood flow or blockages due to stroke or heart attacks. Use of FDG in full body scans can help determine if a cancer has metastasized to other areas of the body. If so, the PET scan can help pinpoint the extent of the cancer’s spread and help identify areas for further treatment or monitoring.
Short Half-lives of Radiotracers
One drawback of most PET tracer isotopes is that they have very short half-lives, which requires their creation using an on-site cyclotron near the PET scanner. The effective half-lives of some of the primary tracers include carbon-11 (about 20 min), nitrogen-13 (about 10 min), oxygen-15 (about 2 min), fluorine-18 (about 110 min), gallium-68 (about 67 min) and rubidium-82(about 1.27 min).
The half-life of F-18 is long enough that radiotracers can be manufactured commercially offsite and shipped to imaging centers for immediate use.
Most nuclear myocardial perfusion exams (which look for ischemia or infarcts in the heart muscle caused by heart attacks) use rubidium-82 (Rb-82). This is produced in a commercially available generator, where the active tracer can be produced on demand in the scanning room. The generator contains strontium-82, which decays into positron-emitting Rb-82. The use of these generators has made PET perfusion imaging feasible and more economical for imaging centers without cyclotrons.
What is a PET Scan Used For?
PET is a primary imaging modality for the detection and tracking of cancer. Nuclear imaging (PET and SPECT) are also considered a standard of care for myocardial perfusion exams to see if there is a lack of blood flow to the heart muscle due to a heart attack. PET scans can also help detect and track neurological disorders in the brain, such as Alzheimer’s disease and evaluation of strokes.
Read about the development of tracers to image Alzheimer’s disease.
FDA approval of the first Alzheimer’s tracer.
Cancer Assessment Using PET
In general, radiologists assess PET imaging to locate cancers and identify any areas of metastasis. Follow up imaging is then conducted to monitor the effectiveness of radiation or chemotherapy treatments by measuring reductions in metabolism or tumor volume.
In nuclear imaging of metabolic tumor response, the standard used is assessment with F—18 FDG PET. Quantitative measurement is made using PET Response Criteria in Solid Tumors (PERCIST) reporting measures. However, cancer treatment is evolving, so while it is important to know these criteria, it is necessary to understand their limitations. This is especially true with the introduction of newer targeted chemotherapy agents, where tumors may continue to grow or maintain size for a long period before a reduction in tumor size is seen. There are other variables with PERCIST, including numerous ways in which the same image can be segmented to make the measurements. There also is no general consensus on the selection of a threshold level, which again can lead to variation depending on who reads the study.
There are also inherent limitations with anatomical response criteria, including when the imaging occurs, who is making the measurements and what is being measured. With nuclear imaging, assessing standardized uptake value (SUV) max may not show a correct assessment of a tumor because it only considers the maximum uptake in one part of a tumor. The uptake may have decreased elsewhere in the same tumor. For this reason it is important to try to assess tumors 2 cm or larger. Metabolic tumor volume is another measure that can be used.
Read more about the role of radiology and PET in assessing cancers and tumor response to therapy.
Managing Radiation Dose in Myocardial Perfusion Imaging
Nuclear myocardial perfusion imaging (MPI) with PET and SPECT have been the gold standard for noninvasive detection of coronary ischemia and infarcts. However, the high radiation doses patients receive are making some providers think twice before referring their patients for nuclear MPI. Public concern over radiation risks from medical imaging have been brought to the forefront with numerous mainstream media articles in recent years.
A Tc-99m SPECT scan averages about 12-16 mSv of radiation dose, and dual isotope studies can be as high as 25-30 mSv. PET scans are much lower dose than SPECT because the Rb-82 isotope has a much shorter half-life.
Newer dose lowering technologies have helped reduce radiation dose by more than 50 percent for cardiac computed tomography angiography (CTA) scans, making it much more attractive as a diagnostic imaging modality. New CT technology — including perfusion imaging with advanced visualization software and CT-fractional flow reserve (FFR) imaging — may lead to increased use of CT.
When 64-slice CT scanners were first introduced a decade ago, CTA dose was 20-30 mSv, but new reconstruction software, more sensitive detectors and other technologies have reduced this below 10 mSv. With the newest scanners and software, it is now possible to perform CTA with about 1 mSv of dose. This new dose profile has made CTA much more attractive, and nuclear imaging now finds itself in the position as the high radiation dose technology being called into question.
Read more about nuclear imaging dose reduction.
Comparison of PET Systems
To see a list of all the PET and SPECT systems currently available on the U.S. market, look at the following comparison chart links on ITN’s website. To view the charts, new users will have to register, which is free and only takes a moment.
Key manufacturers of PET/CT systems include GE Healthcare, Philips Healthcare, Siemens Healthcare and Toshiba. Vendors for PET/MRI systems include GE, Philips and Siemens. SPECT vendors include GE, Philips, Siemens and Digirad Corp.
How much is a PET scan?
Costs for PET scans vary based on region, healthcare system, and the type of scan and anatomy imaged. Insurance companies also pay different rates for various exams. While PET scans for cancer and cardiac perfusion are considered standard, some newer types of PET scans may be considered investigational and may not be covered under insurance.
New Choice Health (www. NewChoiceHealth.com) is a consumer website designed to help patients understand costs involved in healthcare to make more informed decisions. According to NewChoiceHealth.com, for patients not covered by health insurance, a PET scan typically costs an average of about $4,900 for a full-body scan, up to $6,700 for the brain and $6,800 for a cardiac perfusion exam.

 April 10, 2024
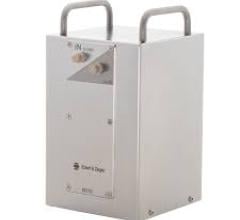


![(A) PET images of [68Ga]Ga-DOTA-ZCAM241 uptake at baseline and 3, 7, and 12 days after injection as inflammatory arthritis developed in single representative individual mouse. Images are normalized to SUV of 0.5 for direct comparison between time points. (B) CD69 immunofluorescence Sytox (Thermo Fisher Scientific) staining of joints of representative animals during matching time points.](/sites/default/files/styles/feed_medium/public/PET%20Tracers.jpeg?itok=P5Di6MIe)